While many new-age internet stocks, including Zomato, Paytm, and Swiggy, have seen their share prices tank in the first quarter of 2025, an analysis of trading data reveals that the volume of shares changing hands has been fairly modest, and large investors have likely stayed firm.
Key Takeaways:
Despite steep price declines in India Internet stocks, data shows this isn't a true "sell-off" as trading volumes remain within normal historical ranges.
Analysis of "churn" (percentage of free float changing hands) and "craziness" (monthly variance in churn) reveals investors are holding positions rather than panicking
Trading value in these stocks fell 25.6% from December to January-February, indicating many investors are sitting on the sidelines rather than exiting positions
Institutional investors haven't significantly downgraded their allocations, suggesting continued faith in the India Internet sector despite the bearish trend
Price Drop ≠ Panic: The nuance around the India internet stock “sell-off”
Since the turn of the year, the Indian stock markets have echoed the bearishness of early 2022, especially for India Internet stocks. To put it simply, the sector—tracked by the NIFTY India Internet & E-commerce Index, which we have written about previously—has been hammered.
Since 8 January 2025, more than 70% of the stocks in this sector have continuously seen negative monthly returns. This has caused many market watchers to bandy about alarmist terms like “crash” and “sell-off” when describing the current public market fortunes of large-cap India Internet stocks like Zomato, PB Fintech, Swiggy, PayTM.
However, there is a difference between prices being down and a sell-off. Prices could fall even if a small number of a company’s shares keep trading down. A sell-off, on the other hand, happens when there is a massive change in expectations around a company and a significant share of its stock changes hands.
Since the turn of the year, the Indian stock markets have echoed the bearishness of early 2022, especially for India Internet stocks. To put it simply, the sector—tracked by the NIFTY India Internet & E-commerce Index, which we have written about previously—has been hammered.
Since 8 January 2025, more than 70% of the stocks in this sector have continuously seen negative monthly returns. This has caused many market watchers to bandy about alarmist terms like “crash” and “sell-off” when describing the current public market fortunes of large-cap India Internet stocks like Zomato, PB Fintech, Swiggy, PayTM.
The hysteria isn’t entirely unwarranted. For instance, Swiggy, which saw its share price touch Rs 556.45 on January 2—its zenith for the ongoing calendar year—has since seen its share price fall to just 331—a 40% fall—as of April 1. Its rival Zomato, which was showered with investor love throughout 2024 for flirting with profitability in a space notorious for high losses, has also seen its share price fall by over 26%, year-to-date (YTD).
The performance of other major India Internet stocks such as PB Fintech (down 28.5% YTD), Paytm (down 18.9% YTD), and Firstcry (down 43.5% YTD) have only furthered the sell-off narrative.
However, there is a difference between prices being down and a sell-off. Prices could fall even if a small number of a company’s shares keep trading down. A sell-off, on the other hand, happens when there is a massive change in expectations around a company and a significant share of its stock changes hands.
With that in mind, relative to history, how significantly have India Internet stocks changed hands in the past two months, and does this support the fatalistic “sell-off” narrative?
Setting a benchmark
It’s easy to see the trendline of a company’s share price emblazoned in red and imagine the worst. However, a dispassionate analysis is necessary to accurately gauge the true sentiment of public market investors.
To do this, we devised an experiment. First, we curated 13 India Internet stocks based on a minimum level of liquidity and some depth of analyst coverage and devised two novel measures to measure how bad the sell-off has been in the first few months of this year.
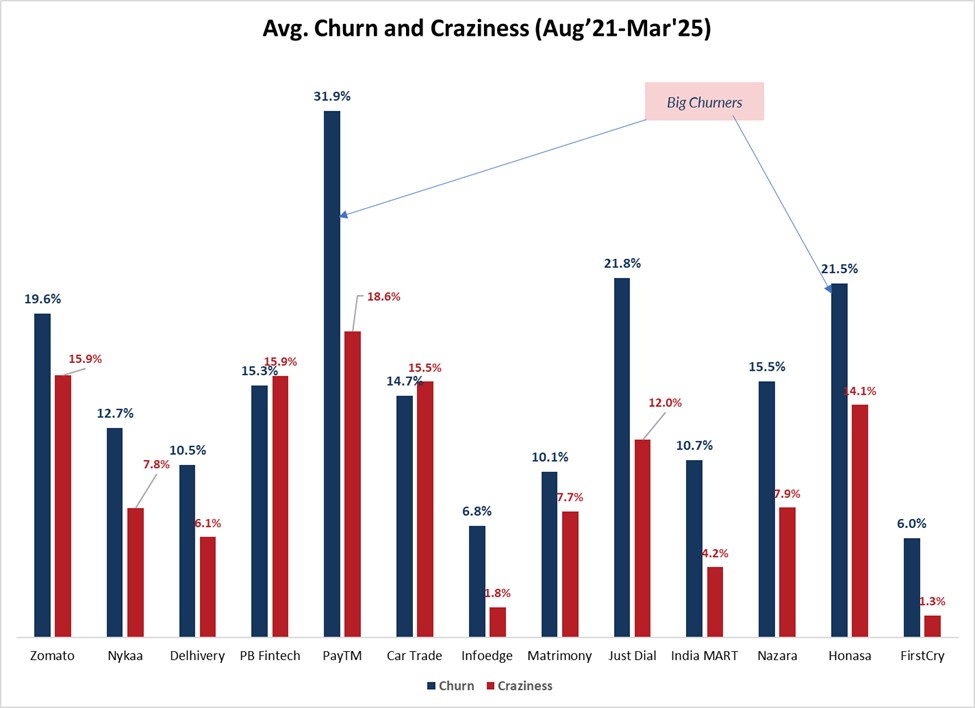
The first measure is easiness, or churn. Churn is the share of a company’s free float—the portion of shares held by public investors—that changes hands each month. Take, for example, a stock with 100 freely trading public shares, where 10 shares change hands each month. By our measure, the stock would have a churn of 10%.
Some large India Internet stocks have low churn, such as Info Edge (7%), have low churn. Others, generally much smaller ones, have high churn. Gaming company Nazara, for instance, has a churn of 16%.
Churn tells you two things. The obvious one is liquidity—how easy it is to buy or sell a stock in the market. Then there is the less understood aspect—narrative stability. One of the most “churned” stocks in the past 3-4 years in India Internet has been Paytm. That behavior is indicative of investors being unable to really calibrate when and how it will attain and sustain profitability.
It has less to do with the health of a company, and more to do with the margin of error around its valuation in the mind of an investor. On the other hand, slightly older India Internet names, such as Info Edge, are well understood. In a sense, the latter is like being in a relationship with the same person for a very long time. Barring a shock, you know what to expect. The narrative doesn’t change that much.
The next measure is “Craziness”. Craziness is the average monthly variance in a stock’s churn. For instance, given that around 68% of data falls within one standard deviation in a normal distribution, a stock with a churn of 10% and a craziness of 6%, will have ~68% of its returns between 4% and 16%.
Craziness is an important measure when it comes to putting churn in context since some stocks are more widely owned by hedge funds and other hot money investors, while others are less so. The former tend to exhibit greater craziness, since big movements only happen when one of these large players decides to pare their stakes.
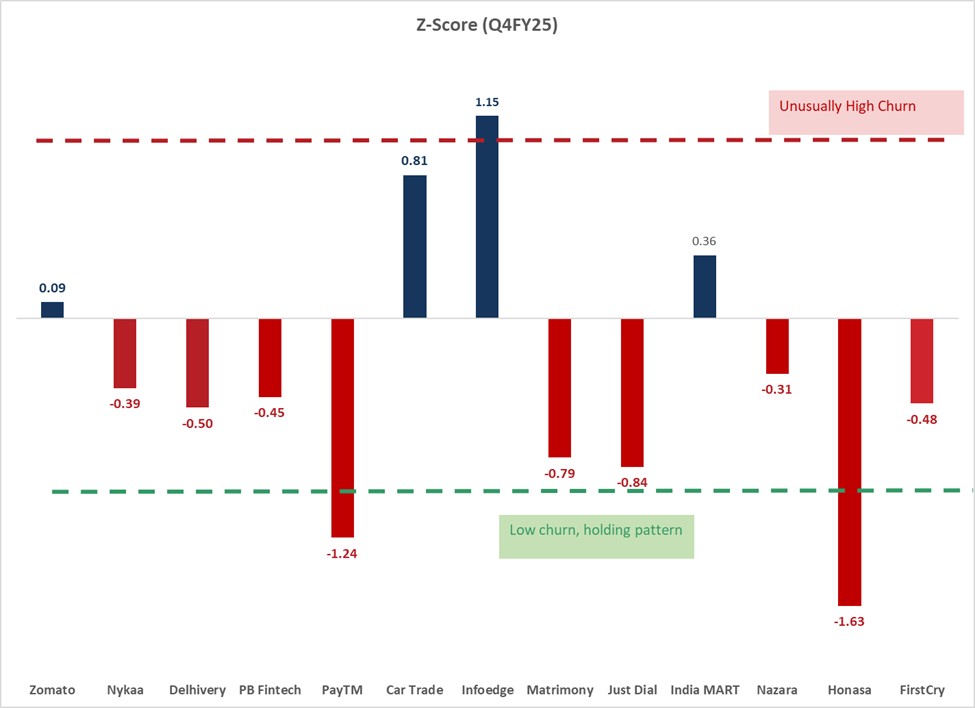
Next, let’s use these measures of “Easy” and “Crazy” to put the current sell-off into perspective. The first step is to devise a Z-score—basically, a measure of how the stock’s churn since the turn of the year differs from its historical churn. The idea is to see, relative to historical measures of a stock’s Churn and Craziness, how steep the change in hands has been in the first quarter of the year. A Z-Score above 1 will show, by construction, a steeper-than-normal sell-off. Below 1, on the other hand, would indicate a more muted sell-off.
Relative to History, the actual sell-off in India Internet Stocks in the first quarter of this year has been rather mild.

Business as usual
Mapping this data throws up some salient facts. On average, 14% of India Internet shares change hands every month. Paytm is the “easiest” stock by our measure, with an average of 38% of its free float shares being traded and delivered each month. Honasa, JustDial, and Zomato are other easy stocks.
Paytm and Honasa are also the “craziest” stocks in the cohort, with their churn fluctuating wildly between phases of market speculation around their financials and block sales. In September 2024, for instance, block deals, with shares likely being offloaded by some of the company’s biggest private market backers, saw 10.9% of Honasa's shares traded in a single day. The high churn and craziness of these companies are also indicative of highly speculative investor interest.
Older India Internet stocks, on the other hand, tend to be both less easy and less crazy. Infoedge, IndiaMART, JustDial, and Matrimony.com, for instance, are largely mature companies whose basic narrative is known and whose storylines do not shift dramatically from one investor to the next. On the other hand, new-age India Internet stocks, especially those which are yet to consistently clock a profit-after-tax (PAT), seem to have easier and crazier behavior.

The figure above compares the Z-scores for the 13 India Internet stocks in the last quarter.
Through the last quarter, barring Info Edge (where valuations at the beginning of 2025 were in excess of 85x), India Internet stocks have seen their churn almost in the normal range when adjusted for craziness. In fact, for Honasa and Paytm, the churn has been unusually low
through Q1 when compared to historical data. Far from a sell-off, that indicates a holding pattern, with a number of investors sitting on the sidelines.
There are other statistics that support this. The average monthly traded value in the same stocks in January and February was Rs 26,800 crore ($3.1 billion). That was down 25.6% from Rs 36,000 crore ($4.2 billion) in traded value in December 2024—well before the markets went south.
So, how is this true even as we witness the steepest decline in share prices since July 2022?
Both realities appear to be true. Prices are falling. But there isn’t yet a widespread panic among investors. Those liquidating have likely sold off at high discounts to their entry points. But there are many more holding on. None of the institutional investors or fund managers covering India Internet stocks at the time of writing have steeply downgraded their allocations. At least by this analysis, the markets show that they still believe in the India Internet story and are hanging on to it by sitting on the sidelines and waiting for the worst to pass.
