As we conclude 2024, this article provides a broader perspective on bulk/block equity deals/ sell-downs. The central argument presented here is that liquidity in public markets is shaped not only by free float but also by a structural cost "overhang risk" the likelihood that majority shareholders will offload shares.
This factor, deeply tied to ownership structure, influences impact costs, making it a crucial component in understanding how liquidity works in large equity transactions.
Impact Resilience Score: A More Comprehensive Liquidity Metric
Refining Liquidity Risk Analysis
Using BSE’s Impact Cost dataset, this analysis applies Impact Resilience Score, a proprietary metric combining:
- Float-weighted market cap
- Ownership structure classification
- Recent bulk/block trade activity
Ownership classifications fall into five distinct promoter categories:
- Family/Individual Promoter-Owned Firms
- Public Listed Companies as Promoters
- Government-Owned Firms
- VC/PE-Funded Companies
- Diversely Held Stocks (DII/FII holdings >75% float)
Key Observations from Liquidity Cost Trends
> Impact Costs Decline with Higher Impact Resilience Scores
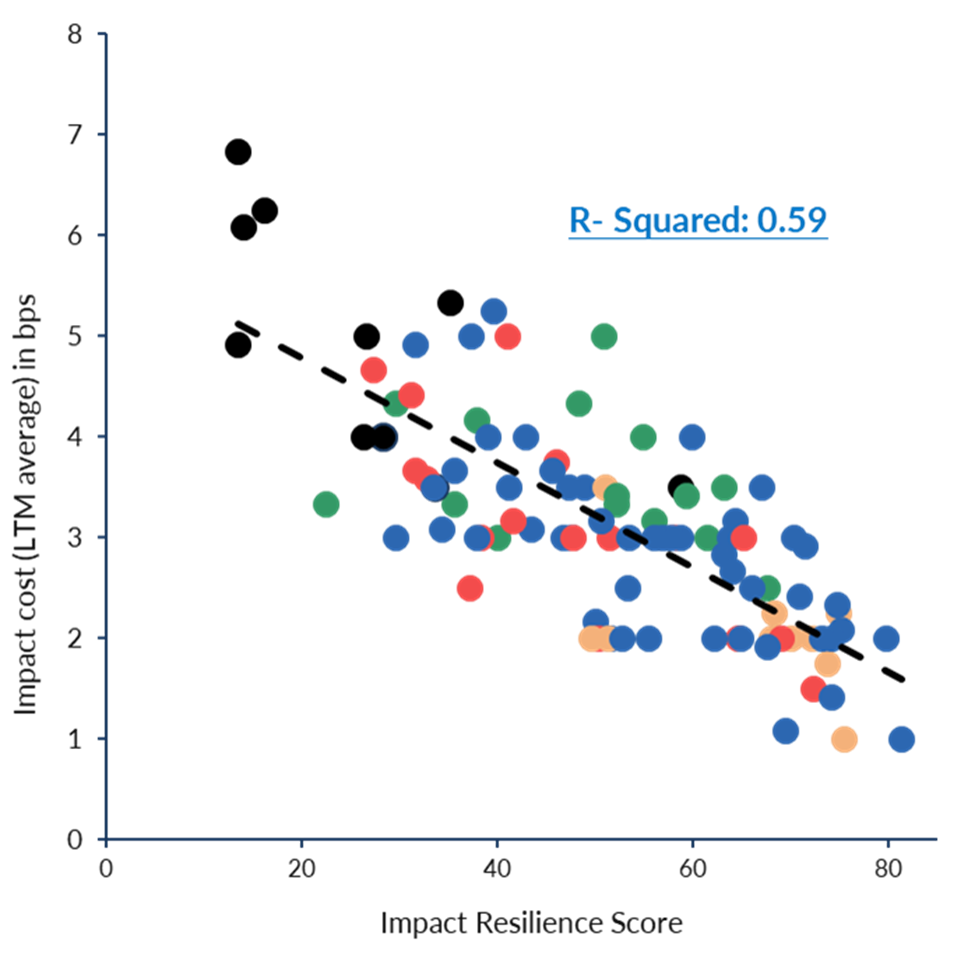
Chart A confirms a clear relationship—impact costs decrease as the Impact Resilience Score increases.

Chart A: Higher the Score, Lower the Cost;
Source: NSE, BSE; 1: Impact cost: % price movement caused by an order of INR 1 lakh from the average of best bid and offer price in the order book. 2: Impact Resilience Score measures the degree of overhang risk – i.e. the risk of a sudden increase in stock/supply demand due to a bulk/block offload
- The R-squared value of 0.59 suggests a strong explanatory power, outperforming the standard float-adjusted market cap measure (which had an R-squared of just 0.25).
- Promoter-held stocks (e.g., Bajaj Group, Aditya Birla Group, Kotak Mahindra Bank Limited) tend to have lower impact costs than their float-adjusted market caps alone would suggest.
> Investors implicitly trust family-owned/individual promoters with not divesting their stakes in bulk. The opposite is the case with firms owned by VC/PE funds.
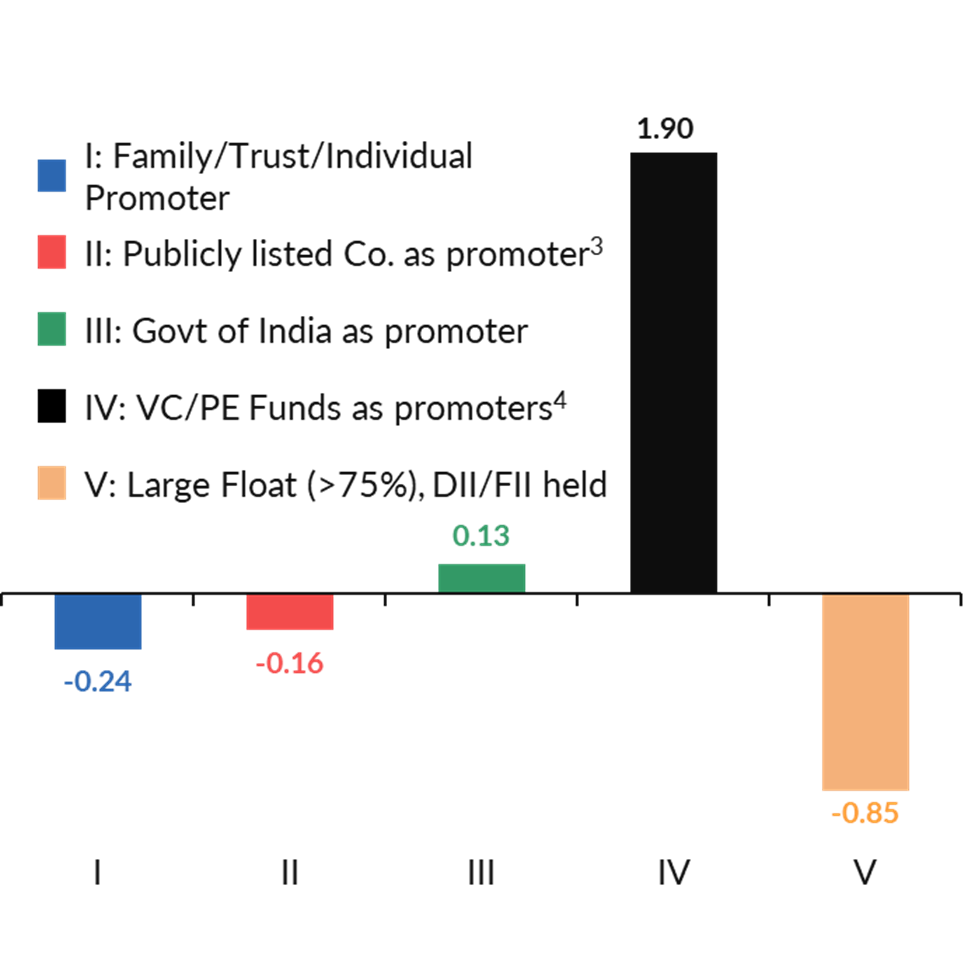
Chart B highlights fascinating deviations in liquidity costs:

Source: NSE, BSE; 3: Includes publicly listed promoters in domestic as well as foreign markets, 4: We have included Hedge Fund holdings
- VC/PE-backed firms (black dots) consistently exhibit higher impact costs, indicating a greater perceived divestment risk among these companies.
- Promoter-owned firms (blue dots) and stocks widely held by DIIs/FIIs (orange dots) tend to experience lower impact costs than industry averages, reinforcing the idea that investor confidence in long-term ownership reduces liquidity constraints.
What This Means for Bulk/Block Deal Execution
The data strongly suggests that markets inherently price in divestment risk based on ownership structure—not just float availability.
By integrating the Impact Resilience Score, institutional investors and corporate dealmakers can:
- Better assess liquidity risks before executing large trades
- Factor in overhang costs when negotiating bulk/block deal pricing
- Fine-tune their strategies based on ownership structure biases across different firms
As markets evolve, tracking these liquidity dynamics will become an essential tool in capital allocation decisions.
