Every City Is Different: How Online Consumption Spend Has Evolved
Background: A City-Level Perspective on Online Spending
This article is part of a broader research collaboration between KIB’s Digital and Robotics team and LinkedIn’s Data Science team members, aiming to map household consumption patterns in India at a granular level. Building on previous analyses of Household Consumption and Expenditure Surveys (HCES), this edition focuses on how online spending has varied across India’s Tier 1 cities in FY23 and FY24.
Methodology: Refining the Data for Greater Accuracy
A key modification in this study, based on expert recommendations, is excluding households that have never made an online purchase.
- The analysis looks exclusively at Annual Transaction Households (ATH)—defined as homes that have at least once purchased something online.
- This ensures that the findings represent active participants in the online economy rather than the broader population.
Key Observations from City-Level Online Spend Trends:
- NCR Leads in Online Spending
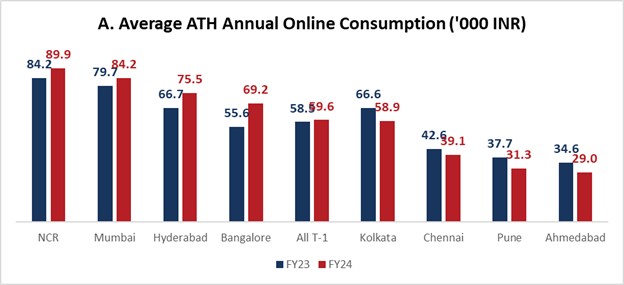
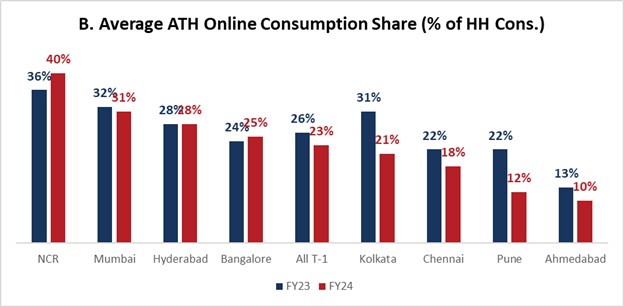
Among India’s tier 1 cities, NCR continues to record both the highest online consumption spend and the highest proportion of online spending.

Chart A: Tier-I City households spend ~INR5K/month online
Source: MOSPI, HCES
- Sectoral Dependence Shapes City-Wise Penetration
A sharp distinction emerges between cities:- Cities with high BFSI/Tech dependency (NCR, Hyderabad, Bangalore, Mumbai) exhibit higher online spending penetration.
- Cities with strong traditional industries or offline trade reliance (Kolkata, Chennai, Ahmedabad) show relatively lower engagement in online commerce.

Chart B: Nearly 1/4th of Consumption spending is online in Tier-I Metro Cities
Source: MOSPI, HCES
Online Spend Share Declined in FY24 - Why?
Despite continued digital adoption, the share of online spending has declined in FY24, but this is a function of overall household spending growth rather than a pullback in online purchases.
- Online spend grew by 2% among ATHs.
- However, overall household consumption rose by 15%, leading to a relative decrease in online spend share.
Shift Away from Durables Mirrors National Consumption Trends
A significant factor driving this trend is the declining share of online spending on durable goods:
- Durable goods’ online spend share fell from 22% (FY23) to 19% (FY24).
- This shift aligns with a broader nationwide trend favoring food and consumer staples over durables.
City-Specific Volatility in Online Spending
Spending patterns vary significantly between cities:
- Kolkata shows extreme fluctuations, while Mumbai and Hyderabad remain more stable.
- Could this be driven by differences in the nature of durable goods purchased online?
- Kolkata’s ATHs may favor highly lumpy purchases (white goods).
- Mumbai and Hyderabad may see steadier online transactions (clothing, footwear, and other regular purchases).
What’s Next? Household Quintile Analysis
In the next edition, the analysis will broaden to include all households’ online consumption spend, organized by income quintiles to assess how different consumer classes participate in digital commerce.
By continuing to refine these insights, future articles on this topic will provide a clearer understanding of digital consumption trends and evolving household behavior.
