In the dance of price movements across India Internet firms, a deeper pattern emerges: sometimes the market rewards individual company performance, other times it moves in lockstep. What is the hidden factor behind this variance, and what does it say about the India Internet market?
Key Takeaways:
- An analysis of India Internet stock price movements show that these stocks sometimes move in sync, but often vary from company to company.
- Between FY22–FY23, for instance, sector sentiment was dominant—fuelled by Covid-era optimism and a retail investor influx.
- Recently, company-specific narratives have begun to dominate again, reflecting growing investor maturity and diversity.
- This shift could influence M&A activity and the long-term success of stock indices like the NIFTY India Internet index.
What India Internet stock prices say about market sentiment
At any time, the commentary around share prices in an industry can be divided into two components. The first explains price movements in a stock in an industry due to industry wide factors. And the other, which explains price movement in a stock driven by company-specific stories. On any day, the perceptions around a company are some combination of these two factors.
The component of the commentary that dominates is important. When sector-wide narratives dominate, there is little to distinguish between a well-run firm and a bad one—everyone rises and falls together. When company-specific ones do, it becomes possible to emphasise a well-run firm and position it at a premium over its peers.
Is there a way to dynamically measure the transition between these regimes? Perhaps only indirectly. In today’s piece, we gather the bread crumbs left behind by daily price movements to develop a theory about narrative regime changes. The outcomes tell us as much about stocks as they do investors.
In April 2020, when the world was still getting used to the idea of lockdowns and quarantines, the stock markets found new favourites. At the time, anything that enabled video conferencing and remote work collaboration—think Zoom, Slack, Microsoft, Cisco, Atlassian, RingCentral, and Dropbox—saw their fortunes rise.
Notably, the jump in the share price of Atlassian through 2020 was more than 2X that of Microsoft, with it usually trading at 5 times the price-to-earnings (PE) ratio of both Microsoft and Google during that period. RingCentral and Slack were not even profitable at the time, and Zoom barely so. However, the market sentiment of not being left behind during a generational shift in work patterns meant that no one was willing to give up on the chase.
A year later, the same set of stocks demonstrated a very different behaviour. Stocks that rode the tailwinds of telecommuting and remote work, which were up 128% in 2020, were up just 11% in 2021. The 2021 performance hid significant dispersion in performance.
Instead, platform plays with diversified revenue streams (Google, Microsoft, and Atlassian) continued to rise, whereas one-trick ponies such as DocuSign, RingCentral, and Zoom landed hard on their backs. Company narratives had overtaken industry themes.
Things are not always so clear-cut when one looks at pricing behaviour. The Covid years were exceptionally choosy when it comes to narrative preferences. However, at any point in time, price behaviour in a sector is some combination of what people think about specific companies and what they perceive for that industry overall.
At any time, the commentary around share prices in an industry can be divided into two components. The first explains price movements in a stock in an industry due to industry wide factors. And the other, which explains price movement in a stock driven by company-specific stories. On any day, the perceptions around a company are some combination of these two factors.
The component of the commentary that dominates is important. When sector-wide narratives dominate, there is little to distinguish between a well-run firm and a bad one—everyone rises and falls together. When company-specific ones do, it becomes possible to emphasise a well-run firm and position it at a premium over its peers.
Is there a way to dynamically measure the transition between these regimes? Perhaps only indirectly. One can survey investors to know their revealed preferences for owning or selling a stock—though the survey sample and its representativeness could become a problem. Alternatively, you could train the proverbial telescope on the markets, crunch the analyst coverage report, and then train some Natural Language Processing (NLP) algorithm to give you a rough probability of what is driving a stock.
Or you can simply use the bread crumbs left behind by daily price movements to develop a theory about narrative regime changes. Which is what we’ll do today. The outcomes, as you will see, tell us as much about stocks as they do investors.
Identifying narratives
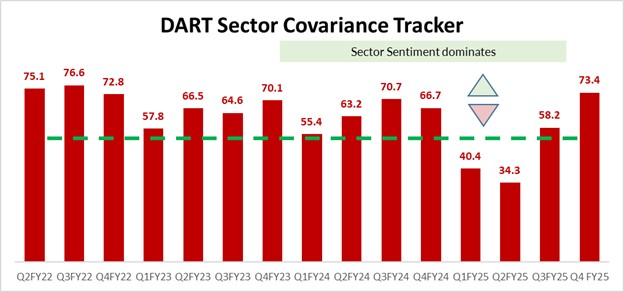
We sought to identify narrative regime changes by measuring price covariance—how similarly stock prices are moving—within India’s Internet space. First, I calculate the rolling monthly price changes for 14 India Internet stocks, beginning in July 2021. We then segment the data into specific quarters, giving us 1,260 observations (14x90) for each quarter.
Next, we employ a very simple form of machine learning—Principal Components Analysis, a statistical tool to find patterns—to calculate what share of the variance in prices each quarter is explained by a hidden common factor.
One should think of this invisible factor as some market perception that acts like a force field, pulling all the stocks in the industry in the same direction, whether up or down. When it dominates, the co-movement of stocks is high. When it weakens, stock price movements disperse.
Finally, we index this common factor to create a Sector Covariance Index (SC Tracker) which runs from 0 to 100. Lower values would indicate a weaker common factor, meaning we would see more dispersal in stock price movements across companies in the industry. That would imply that company narratives are dominating the sector. Winners win all, losers go down hard. On the other hand, higher values would indicate a higher degree of co-movement. Implying that industry perceptions—good or bad—might be driving the prices.

Once unpacked, the data tells an interesting story. Between Q2-Q4FY22, more than 70% of the variance in prices could be explained by sector sentiment. This also checks out anecdotally. In late 2021 and early 2022, much of the movement in India Internet stocks was not driven by individual narratives.
There was no reason why massively cash-guzzling names like Paytm, improving-but-still-in-the-red candidates such as Zomato, and mildly profitable players such as Nykaa and Car Trade should have seen similar treatment by the markets. It was simply about confidence in the space– and later, the loss of it—that investors had around sector valuations and the India Internet narrative.
This was also a time when new retail investors, stuck working from home and with disposable income piling up, flooded into the market. For perspective, India had 31 million unique investors registered with the National Stock Exchange (NSE) in FY21. By FY21 this had jumped nearly 30% to 40 million. As of November 2024, this number stood at 107 million.
This means that during the early days of Covid, there was an influx of investors who perhaps weren’t as clued into the fundamentals of the stock market, investing instead on the basis of their personal familiarity with companies or wider popular perceptions.
From groups to individuals
After this initial surge during the pandemic, however, the importance of sector sentiment (while marginally up sometimes) has structurally diminished. In H1FY25, less than 45% of the price variance in India Internet stocks was explained by sector-specific factors. Each stock has now been perceived to be a different story, with each firm having an individual identity and possibly different operating margin trajectories.
However, following the global rise in risk aversion and a fall in emerging market equities, the sector sentiment once again emerged as the driving factor for prices in H2FY25. Concerns around an open economic conflict between the US and China, a perception of general overvaluation in Indian equities by foreign investors, and economists forecasting a sharp global economic slowdown in the coming quarters meant that, irrespective of their individual performance, India Internet stock prices have collectively moved down, especially since January this year.
Another interesting aspect is how sector sentiment is usually dominant in price narratives for India Internet during the festive months—in the second half of every financial year. One could speculate that festive months usually see investor perception influenced by India’s consumption story. The prevailing sentiment around the strength of household demand—ably aided during this period by aggressive sales and offers by Indian internet companies—in these months tends to drive India Internet stocks more in the second half of the year than in the first half. It would be interesting to see if this seasonality in narrative regimes extends even to the broader stock markets.

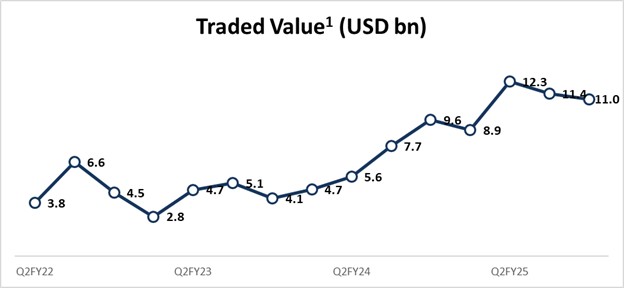
In the past 2 years, sector sentiment-driven quarters are also when investors tend to stay on the sidelines, holding rather than trading India Internet stocks if the general price movement in stocks is downwards. For instance, in Q4FY23 when the investors weren’t clear whether the India Internet tailwinds would endure post Covid, overall trade volumes fell by 20%, even as the prices declined. This once again happened in H2FY25.
This is a tacit vote of confidence, in the longer run, for India Internet firms. Investors tend to add or shift their allocations to these stocks when company narratives dominate, and tend to stay on hold when the prices are affected by market-wide factors.
This could indicate two things. First, a rising maturity in investors in internet stocks in the country. Second, an increasingly diverse investor participation in this corner of the markets, which could result in a less reactionary approach to industry wide factors.
In the longer run, this could have two implications.
One, we might be seeing an increasing barbellization in India Internet stocks. Indian investors may now favour some better run business models, anticipating they will outperform the broader space. This should reflect in their prices and overall performance. The structural increase in company-specific narratives being the dominant driver of stock prices in India Internet should continue, with investors allocating more towards outperformers.
That should also have a bearing on the overall sector, and an index that leans heavily in favor of barbelled, heavily-traded outperformers is likely to do better than the recently-introduced NIFTY India Internet index even in the future, should these trends continue.
Second, if company-specific narratives continue to dominate (assuming that they do so on the back of some relevant market information), this could create more accretive merger and acquisition (M&A) transactions. Corporate action (mergers, spin-offs, and acquisitions), after all, is all about the ability of a company's management to show their shareholders the ability of their targets to be a differentiated proposition. The more grounded that proposition is in reality, the more valuations are reflective of company-specific narratives, and the better those judgment calls are likely to be.
