NSE’s new benchmark, the NIFTY India Internet & E-Commerce Index, attempts to curb risk through diversification. But is diversification masking real risks, and can liquidity offer a clearer path to high returns in India’s evolving internet space?
Key takeaways:
- In February, the NSE launched the NIFTY India Internet & E-Commerce Index, a curation of companies that conduct business through online platforms
- While the index is sure to play an important role in making capital market decisions going forward, its focus on diversification could result in suboptimal returns for investors
- Instead, a liquidity-weighted index outperforms the official one, suggesting investors value transparency and information in India's evolving internet market
- However, the three most liquid stocks, year-to-date, in India Internet—Zomato, Swiggy, and Paytm—make up only 32% of Nifty's new index, potentially shortchanging investors
Why diversification isn’t the answer for India Internet stocks
On February 28, the National Stock Exchange (NSE) launched the NIFTY India Internet & E-Commerce Index. Another one of NSE’s thematic indices, it’s focused on companies that conduct business through online platforms. The idea behind the index—or indeed, indices at large—is to create a benchmark for asset managers and to be a reference index tracked by passive funds (exchange-traded funds (ETFs), index funds, and other structured products).
The creation of the NIFTY India Internet & E-Commerce Index (NI3 index) couldn’t have come soon enough. Today, much of our economic transactions—be it grocery, fashion purchases, and travel booking, for instance—increasingly happen digitally. However, to prevent a very large cap company from dominating the index, NSE puts a cap on the maximum weight a stock can have. The idea is to create a diversified index, which reduces the concentration risk of being invested in a few large stocks in the index.
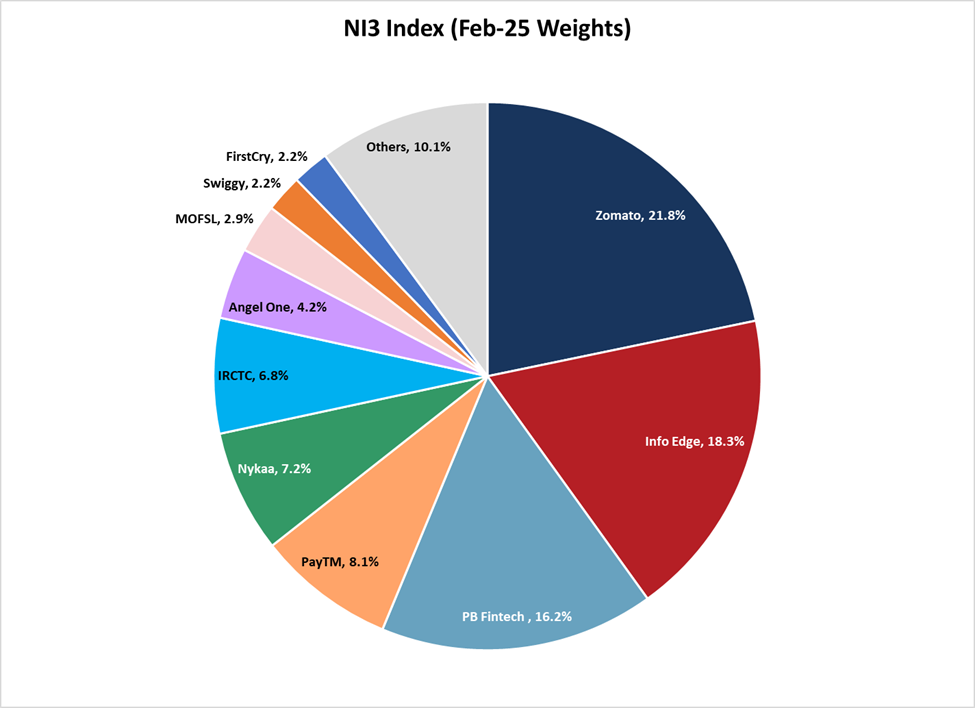
The NI3 Index, for its part, caps the weight of each of its constituents at the end of each quarter at 20%. Among the 21 stocks, Zomato holds the highest weight at 20.3%, with its investor Info Edge next in line at 18.83%. PB Fintech rounds off the top three with a weight of 16.72%.
But does diversification of one’s portfolio really work in a new industry where investment analysts, and sometimes even executives, are still in discovery mode and don’t really know which business models work?
On February 28, the National Stock Exchange (NSE) launched the NIFTY India Internet & E-Commerce Index. Another one of NSE’s thematic indices, it’s focused on companies that conduct business through online platforms. The idea behind the index—or indeed, indices at large—is to create a benchmark for asset managers and to be a reference index tracked by passive funds (exchange-traded funds (ETFs), index funds, and other structured products).
The best way to think of an equity market index would be to imagine a sushi platter. Say you walk into an upscale Japanese restaurant with a vague craving for sushi, but you aren’t very specific about what you want. Your tastes are global, but not very refined yet. So, you go for a sushi platter—something that exposes you to a wide variety of fillings and wrappings.
That is exactly what indices do. They allow investment managers to fulfil a general craving for investment exposure without them having to scratch their heads over a specific stock. At present, NSE offers 50-plus such curated indices, offering exposure to stocks of a particular size (small-, mid-, and large-cap), sector (auto, banks, etc.), big domestic economic trends (housing, tourism, ESG, and most recently, India Internet).
The creation of the NIFTY India Internet & E-Commerce Index (NI3 index) couldn’t have come soon enough. Today, much of our economic transactions—be it grocery, fashion purchases, and travel booking, for instance—increasingly happen digitally. This holds true even beyond India’s large metros. For instance, more than 35% of fashion and beauty and personal care e-commerce happens outside metros, 94% of online travel platform Ixigo’s bookings have a non-metro leg in travel, and 74% of agents of PB Fintech’s B2B offering (PB Partners) are based in Tier-2 cities and beyond.
So, it was just a matter of time before NSE met the demand for this new cuisine by offering its own platter. Broadly, there are three motives behind the new index:
- It offers passive retail investors investing via Systematic Investment Plans (SIPs) a way to choose mutual funds (though none have launched yet) that will track this index.
- It could prompt the creation of low-cost ETFs, making it easier for investment managers to buy them for their clients without spending time and money hiring analysts to research and pick specific stocks.
- It will also serve as a reference point for a sizable number of companies who are looking to go public in the near future, helping them calibrate their public market valuations and investor returns when they do so.
The index’s performance is sure to play an important role in making capital market decisions going forward, and thus bears an important burden of responsibility towards investors. But is it an optimal way to invest/evaluate India Internet as a theme? Is it reflective of real buy-side demand in this sector? And, perhaps most importantly, is it possible to create a better index than the new benchmark—one that could offer better returns to investors and fund managers?
The diversification dilemma
The NI3 Index runs from October 1, 2021, and weights 21 India Internet Stocks1 by free-float market cap.
For the uninitiated, here’s a simple way to understand free-float market cap weighting for an index. Assume that Stocks A, B, and C have market caps of 300 crore, 700 crore, and Rs 1,000 crore, with 10%, 10% and 60%, respectively, of their common shares listed. Their market-weighted float will be Rs 30 crore, Rs 70 crore, and Rs 600 crore, and their weightage in the index will be 4.2%, 10%, and 85.8%, respectively.
However, to prevent a very large cap company from dominating the index, it puts a cap on the maximum weight2 a stock can have. The idea is to create a diversified index, which reduces the concentration risk of being invested in a few large stocks in the index. The NI3 Index, for its part, caps the weight of each of its constituents at the end of each quarter at 20%. Among the 21 stocks, Zomato holds the highest weight at 20.3%, with its investor Info Edge next in line at 18.83%. PB Fintech rounds off the top three with a weight of 16.72%.
But the bigger question is, should we even worry about the risks of non-diversification? Does diversification of one’s portfolio really work in a new industry where investment analysts, and sometimes even executives, are still in discovery mode and don’t really know which business models work?
For instance, it wouldn’t be remiss to say that despite financial services making up 34% of this India Internet Index, the stock with the second largest weight in this sub-vertical—Paytm—is yet to show sustained profitability. Market narratives around other audacious bets in quick commerce (Swiggy, Zomato) or consumer product disintermediation (BPC players Honasa and Nykaa, for instance) are all subject to high levels of volatility. They remain highly sensitive to local and global interest rates, which determine how easy it is to lean against narratives and wait for the numbers. Especially when some of the major companies in the India Internet space seem to be re-prioritising capex/customer acquisition over any well-defined operating margin target.
In fact, why even go to the extent of diversification and not simply own a portfolio of the most traded stocks in the NI3 Index?
Liquidity lessons
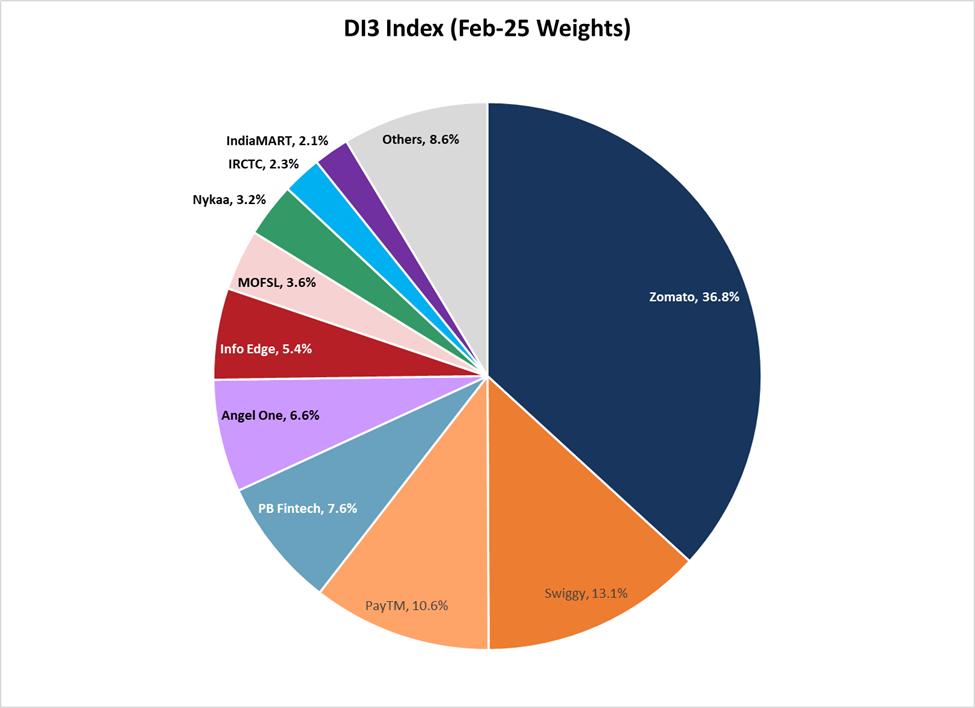
To test this, let’s create an alternate India Internet Index (DI3), which weights stocks on the basis of their liquidity in the markets. Each quarter, the stocks are weighted based on their traded2 value in the previous quarter.
Liquidity weighting of stocks works fairly simply. Assume that we have the same stocks A, B, and C. Each quarter, Rs 18 crore, Rs 7 crore, and Rs 120 crore of these stocks are traded, respectively. Their liquidity-based weights will then be 12.5%, 5%, and 82.5%, respectively.
Which index ultimately wins out will ultimately hinge on two things. First, are investors who follow the DI3 index taking undue concentration/diversification risk?
On the flipside, putting a ceiling on free float-weighted market cap means that the NI3 index will have a higher share of less liquid stocks than the DI3 index. There is plenty of economic literature3 that suggests that owners of illiquid stocks have higher expected returns in the long run because they are taking higher risks.
In 2006, Professor Aswath Damodaran compared the ownership of illiquid stocks (assets) to owning something with a high likelihood of remorse. The more illiquid an asset, the greater the likelihood that it might turn out to be something you didn’t want and that you couldn’t sell it easily. That is why, when you own it, you require a higher return. This is something that all smart venture capitalists do (albeit in a different context). So, we need to see whether the NI3 index really compensates potential investors for this risk.
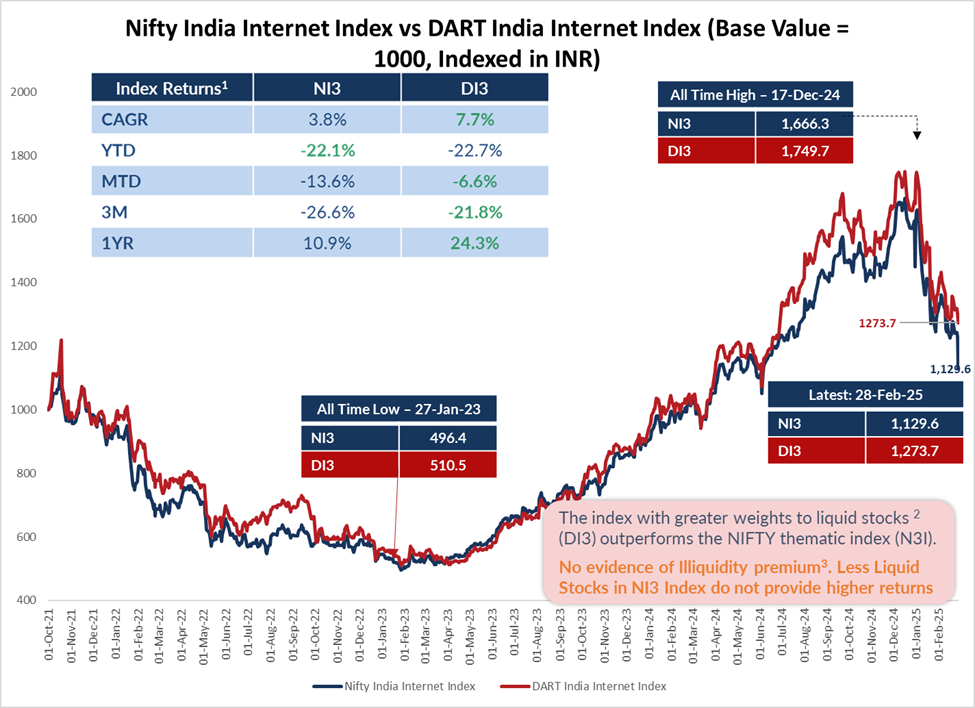
Illustration 1: The Liquidity Weighted DI3 Index consistently outperforms its NIFTY counterpart (NI3)
Sources: CapitalIQ, NSE, Bloomberg; 1: Index Returns are Total Returns here; 2: Refer to the Appendix for the list of stocks considered here; 3. Hypothesis based on the works of Damodaran (2006) and Amihud, Hamid, Kang and Zhang (2013), which is rejected
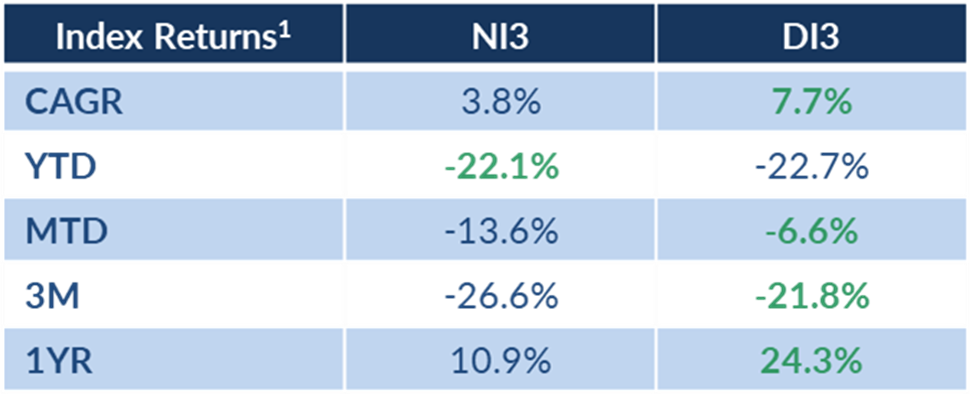
The chart above compares the performance4 of our liquidity-weighted index (DI3) against a back-calculated NIFTY benchmark (NI3) between Oct 2021 and Feb 2025. The table below compares their returns on a cumulative annualised growth rate (CAGR), year-to-date (YTD), month-to-date (MTD), quarterly, and yearly basis.
Sources: CapitalIQ, NSE, Bloomberg; 1: Index Returns are Total Returns here; 2: Refer to the Appendix for the list of stocks considered here; 3. Hypothesis based on the works of Damodaran (2006) and Amihud, Hamid, Kang and Zhang (2013), which is rejected
The conclusion is clear. The DI3 index outperforms the NI3 benchmark across all time horizons (except the YTD basis). Its peaks are higher and its drawdowns are lower.
The fact that the DI3 index, which gives higher weightage to liquid stocks, outperforms the Nifty benchmark implies that there is likely no illiquidity premium. India Internet investors are not compensated for holding arcane, small, and relatively illiquid names (Thomas Cook, Rattan India, IRCTC).
Risky business
But there could be a genuine objection here. Could the liquidity-weighted DI3 index simply be a case of higher risk-higher return? And therefore, while the Nifty Benchmark may not be the only way to look at India Internet, it may still be the most optimal one for the asset manager.
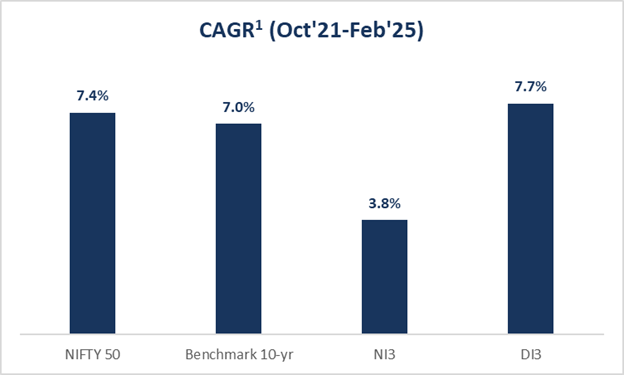
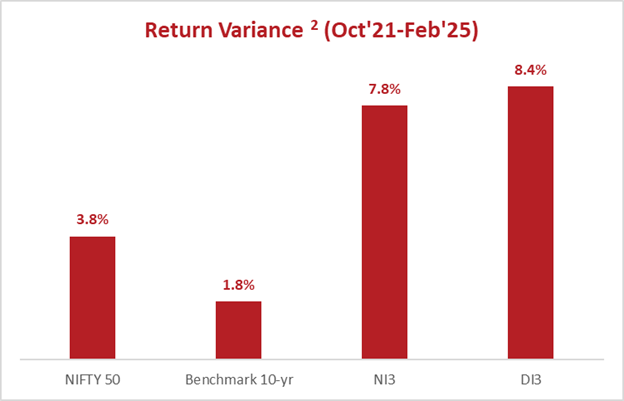
The chart below compares the CAGR (annualised returns) and variability in monthly returns for four benchmarks—NI3, DI3, 10-year government bond, and the NIFTY 50 Index. We do this for the period in which the NI3 index exists (Oct 2021 to Feb 2025).
Sources: CapitalIQ, Bloomberg, NSE; 1: CAGR for all items except Benchmark 10-yr yield. Period average considered for the yield. 2: Standard deviation of monthly returns. For benchmark yields, standard deviation of monthly harmonic returns
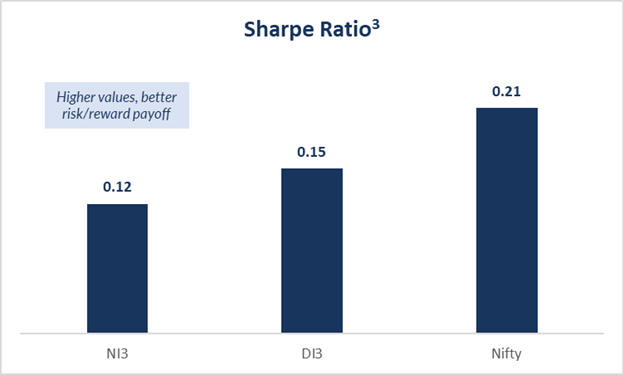
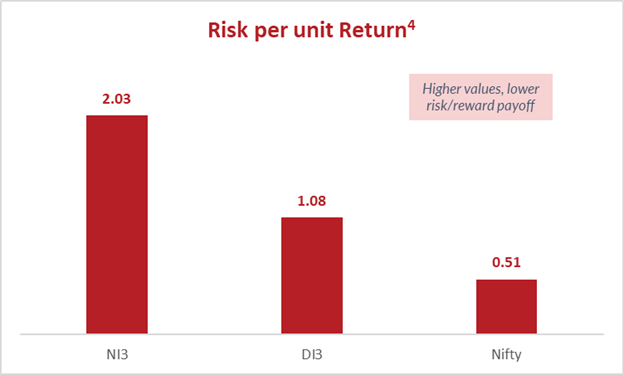
That on its own, though, isn’t necessarily conclusive. A better way to answer this question is to look at measures of risk-adjusted returns. We can do this in two ways:
- Sharpe Ratio: How much extra return would an investor get (vis a vis a 10-year government bond) per unit change in returns (volatility). Think of it in terms of a batter in a cricket match. You are better off playing a high-risk shot towards a shorter boundary (better Sharpe Ratio) than playing the same shot towards a longer one (worse Sharpe Ratio).
- Risk per unit return: The average risk (volatility) per unit return. Rational people would likely choose an investment that offers 10% return with 5% variation over the years (risk per unit return of 0.5), than one which offers 20% with a 40% variation (risk per unit return of 2).
On both these measures, our proxy index (DI3) tends to outperform the NIFTY benchmark (NI3). However, both tend to underperform the broader NIFTY Index, highlighting the somewhat inflated private market valuations of India Internet stocks.
The latter part isn’t a surprise to market watchers. Year-to-date, the NIFTY price-to-earnings ratio has varied between 20-23X, whereas even after a significant drop in prices, the same metric for the largest India Internet firms is either undefined (because they aren’t profit-after-tax (PAT) positive) or is in triple digits (Zomato, Nykaa, PB Fintech). Generally speaking, a lower PE ratio is better since it implies that a stock is cheap and has high upside.
Lest we bring out our cynical smiles here at this last clause, we must remember that non-linear growth has been what investors in consumer internet stocks have always chased. In the early part of the last decade, people had similar objections around the valuation of Amazon, however, the years since have seen the American e-commerce titan prove its doubters wrong. EBay and Yahoo, however, couldn’t emulate Amazon’s fortunes.
Stocks with non-linear profit/growth trajectories are fundamentally difficult to read and invest in. It wouldn’t come as a surprise if the broader NIFTY index retains its outperformance over NI3 and DI3 in the near term.
Sources: CapitalIQ, Bloomberg, NSE; 3: Benchmark 10-yr considered as risk-free asset, rolling monthly excess returns considered (Oct’21-Feb’25); 4. Standard deviation of monthly returns; 5. Weights = Average Quarterly Traded Value for a stock/Average Quarterly Traded Value for the cohort
A suboptimal view
All of this boils down to one message. If you are an asset manager or an ETF or a potential founder looking at India Internet from the lens of the NIFTY benchmark, you are getting an underwhelming view.
The returns of this index are not just lower than a liquidity-weighted proxy (DI3), they are inferior even on a risk-adjusted basis. A 3.8% CAGR for 7-8% volatility in monthly returns is no compensation. And this is just in contrast to a fairly facile alternate index. Fund managers could likely construct multiple combinations of India Internet stocks (at reasonable costs) that could likely be more effective than the DI3 index.
So, why is owning more of well-known and well-traded India internet names a better way to generate investor returns than going after smaller, unloved ones?
Sources: CapitalIQ, Bloomberg, NSE; 4. Standard deviation of monthly returns; 5. Weights = Average Quarterly Traded Value for a stock/Average Quarterly Traded Value for the cohort
Perhaps what we are seeing is a “flight to quality”. Traditional financial theory says that in a perfect market, information about well-covered stocks might be arbitraged away. In time, their excess returns over the benchmark might be lower than those for smaller, less covered stocks. However, that might not be the case for newer industries.
India internet could be one of those. The fact that a liquidity-weighted index performs better than the NIFTY benchmark indicates that investors might be paying a premium to own highly liquid stocks. The three most liquid stocks, year-to-date, in India Internet—Zomato, Swiggy, and Paytm—make up 32% of the NI3 index, but ~60% of the DI3 index. The average number of analysts covering the top five stocks in the DI3 index is 3X higher than those covering the others. High liquidity here likely comes from better information disclosure around the companies, both in terms of operating and financial metrics. That, in turn, might have driven better performance.
It is possible that in an industry where business models and paths to profitability are still evolving, being more analyzed and open might help a company’s case. Investors might be flocking to these names or allocating more to them simply because they have a better handle on what is going on at, say, a Zomato or a PB Fintech or an Angel One.
By putting a weight cap on larger names in India Internet, NSE possibly ends up solving for lesser risk through diversification, for which investors are already sufficiently rewarded. In turn, it exposes them to a greater risk—that of information asymmetry around business models in a new industry—for which they are not optimally compensated.
The Nifty India Internet & E-commerce Index is less than a month old. And it remains to be seen how many asset managers, ETFs and structured product teams use it as a benchmark or reference point. At this stage of the India Internet story, though, it appears a suboptimal lens to look at the sector as a whole.
Appendix:
Component Stocks of NI3 and DI3 Index: AngelOne, FirstCry, Car Trade, EaseMyTrip, Nykaa, IIFL Cap Services, IndiaMART, IRCTC, Infibeam, InfoEdge, JustDial, Ixigo, Motilal Oswal Financials, Nazara, PayTM, PB Fintech, Rattan India, Swiggy, TBO Tek, Thomas Cook, Zomato
Weighting: NI3 Index weighs stocks basis free float market cap, with a 20% maximum weight. Can exceed the cap between quarters. DI3 uses a quarterly Average Daily Trading Value weighted index
