Key Takeaways:
- Each big Indian city spends differently across various income groups.
- Some, like Mumbai and NCR, are polarised with both high and low-spending households. Others, like Chennai and Ahmedabad, show a more balanced spread.
- The real difference between cities lies at the top, and most variation in spending comes from the top 20% of households while lower-income segments behave similarly across cities.
- Spending is up among mid-income households in most cities, but actual wallet sizes are still modest.
A Tale of Seven Seas
“Saat Samundar” or “Seven Seas” was a pre-modern concept used by Medieval sailors in the Indian Ocean to mark the zones of passage, from Egypt to China, via India. Each “Sea” -Persian, Arabic, Bengal, Moluccan, Singaporean, Thai and Chinese- was supposed to have its own color, weather patterns, and fish - its distinct geological boundaries. Navigating each required a different skill, and an intimate understanding of its temperatures and under-currents.
This article is a first in a series of our explorations of Tier-I Cities in India. Our effort, like those sailors who might have set out from Indian ports a thousand or more years ago, is to understand the depth, undercurrents and temperature of these Seven Seas, to come up with actionable insights.
What is new with our approach?
Since their release in mid-2024, the Household Consumption and Expenditure Surveys (HCES) by the government have gathered significant media attention. However, the focus has been on national aggregates released by the Ministry of Statistics and Program Implementation (MoSPI).
Our analysis uses HCES survey-level data in the National Data Archive for individual household (HH) spending. It covers over 15 thousand households sampled in seven Tier-I cities of India – NCR, Greater Mumbai, Kolkata, Chennai, Bengaluru, Hyderabad, Ahmedabad.
We look at HH level spending patterns across cities, which are different from the more usually cited income distribution patterns. An analysis of HH spending has its own importance - HH budgets are more indicative of intent to spend and hence actionable for companies.
Bi-Modal, Bridge and Balanced: 3 kinds of Tier-I Cities based on household spending
Look at the charts below
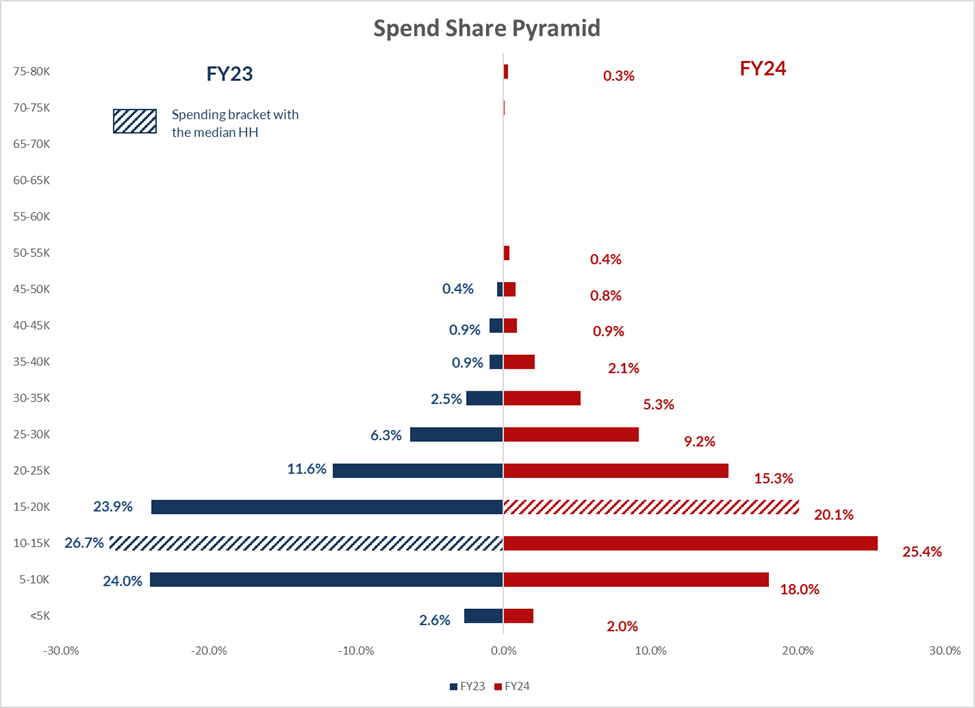
Chart A
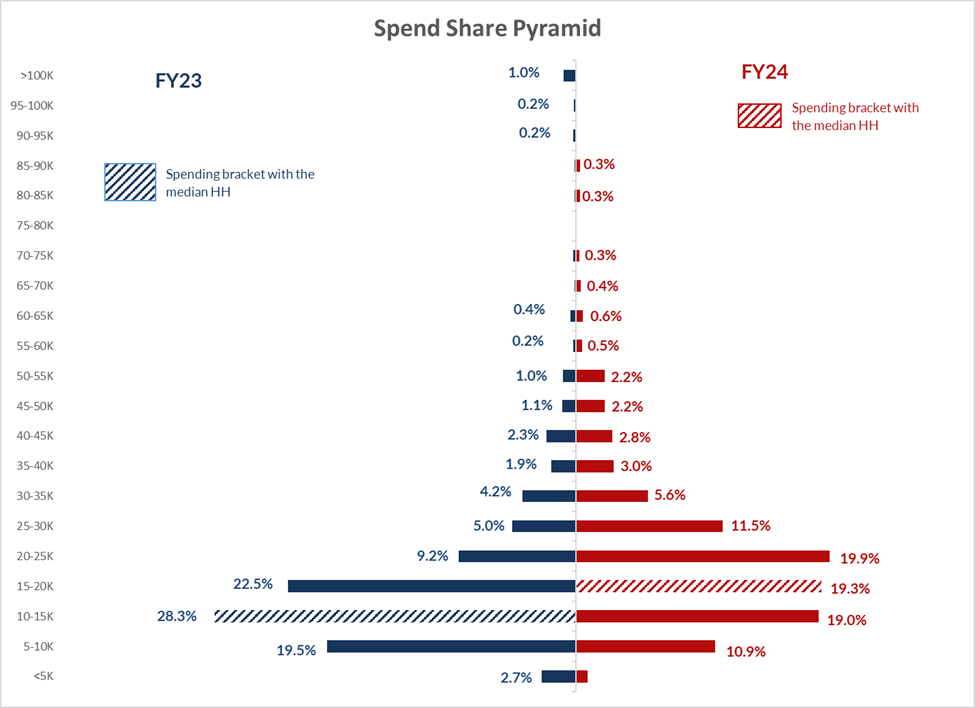
Chart B
They show the percentage of households, in each spending bracket, over FY23 and FY24.
For illustration, in the city on the left (City A), 18% of households were spending between INR 5-10K (ex-rent). Or that 1% households had a spend of more than INR 100K ex-rent in City B
What differentiates these charts is the degree of bunching around the median spending (shaded bars). Notice how big the range of spending is in City B, compared to City A!
City A is Chennai. City B is Mumbai.
Before we get ahead of ourselves, let us formally define a framework to see the dispersion of spending in India’s Tier-I Cities.
The Chart below shows a way to understand this.
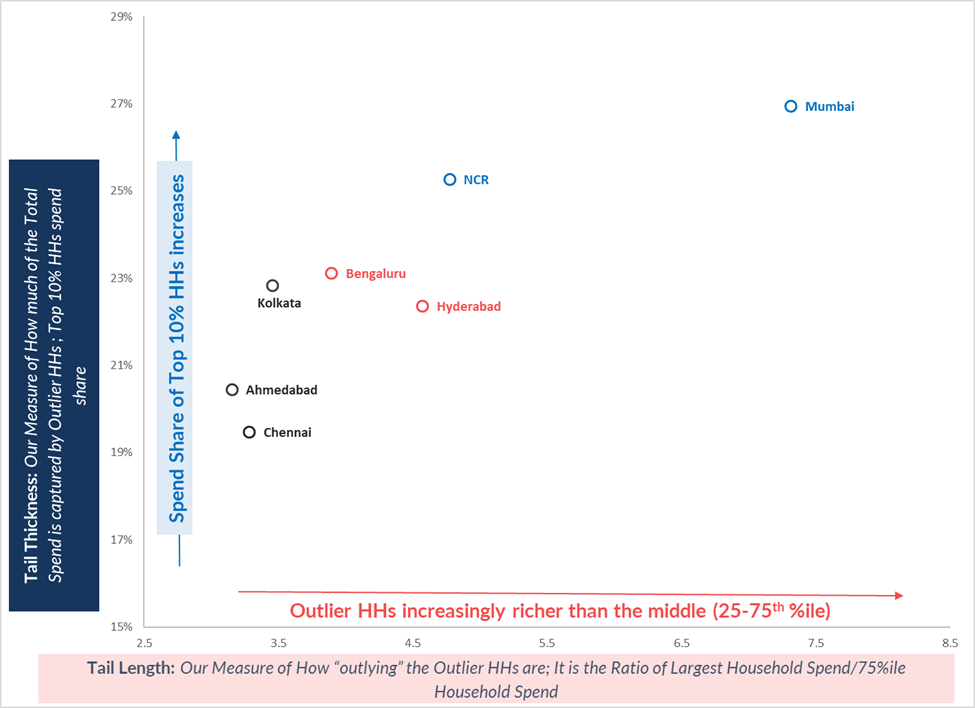
Chart C: Mumbai and NCR Have A Thick And Long Tail of High Spending HHs; Bengaluru And Hyderabad Have An Emerging (But Slightly Thinner) Affluent HH Cluster; The Rest Are More Homogenous
Source: HCES, MoSPI
The x-axis measures “Tail Length” – how big, compared to the 75th percentile household is the largest spending household. It gives us an idea of the wallet size of the most elite customers in the city.
The y-axis shows “Tail Thickness” – what percentage of total spend in the sample is made by the Top 10% HHs. It shows how big that market of elite/premium customers is.
Mumbai and NCR stand out. They have long and thick tails. Or, they have a substantial number of high spending HHs. In contrast, while Hyderabad and Bengaluru aren’t different from NCR in terms of Tail Length – they have customers with similar wallet size as NCR. But they don’t have thick tails – there aren’t enough of elite customers compared to NCR.
Relative to these Tier-I Cities, Kolkata, Chennai and Ahmedabad tend to have a more even distribution of spend – thinner and shorter tails.
Notably, Mumbai has a thick and long tail on the opposite end too. Apart from having many HHs with large wallet sizes, it also has many HHs with extremely small wallet sizes. The city of dreams is also a city of extremes.
Therefore, we divide the Tier-I Cities into three clusters, with different business implications.
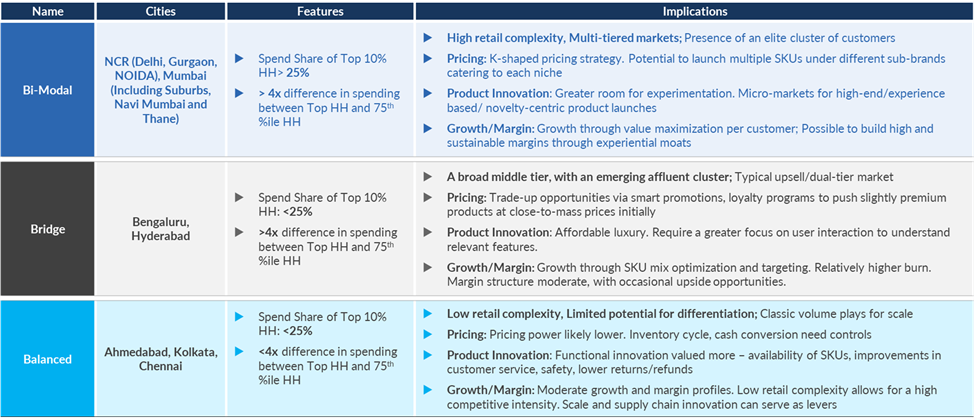
Table 1: Each cluster has different strategic implications for brands catering to its customers
Source: MoSPI-HCES
Bi-Modal markets like NCR and Mumbai have high levels of retail complexity and multiple customer tiers. They have the right critical mass for premium/experiential products and offer opportunities to businesses to build sustainably high margins through experiential moats.
Bengaluru and Hyderabad are Bridge markets. Ones with emerging pockets of affluence, but not there yet. These are places for classic up-sell/cross-sell sales strategies. Excelling here requires understanding product features intimately, focusing on affordable luxury and SKU optimization
Kolkata, Ahmedabad and Chennai are Balanced markets. They have low retail complexity. A low retail complexity doesn’t mean a low spending power. It simply means the variation in spending across households is low. That makes them ideal for scale/ volume plays, but with high competitive intensity.
The Seas Beneath the Surface are Remarkably Similar
One of Tolstoy’s more quotable quotes in Anna Karenina is – “Happy Families are all Alike, every unhappy family is unhappy in its own way”
In a different context, the chart below shows something similar happening in each Tier-I City. Until the 80th percentile HH, the range of variations in budgets across cities is small. All the variance we see in spending between say Gurgaon and Kolkata really comes down to the Top 20% HHs by spend.
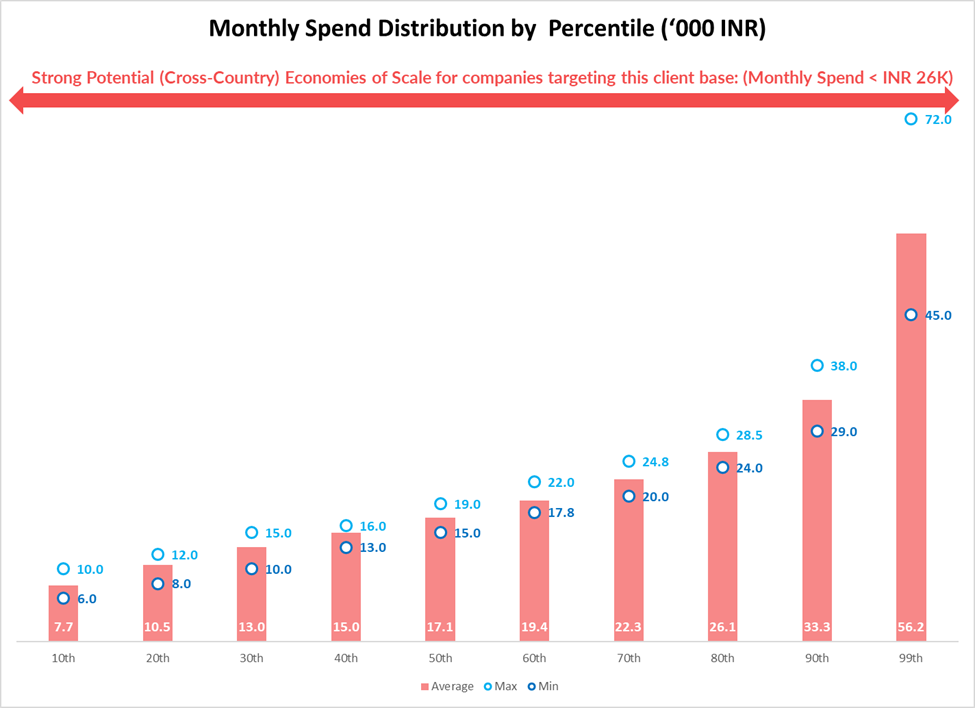
This also means that for a business building for HHs spending less than INR 26K per month, it could potentially build with strong economies of scale. They don’t have to resort to tiered pricing or differentiated inventory or logistics networks; customers have a common intent to spend up to this level.
The Spend Share of Top 1% and Top 10% HHs has fallen
On average, the share of Top 1% and Top 10% HHs in spend has fallen by 0.7 percentage points (pp) and ~2 pp in FY23 and FY24. This trend in Tier-I Cities mirrors the aggregate urban trends at the national level. Top 10% Urban HHs share of spend fell from 25.7% to 23.7% (down 2pp) over the same period. (Table 3.14 HCES)
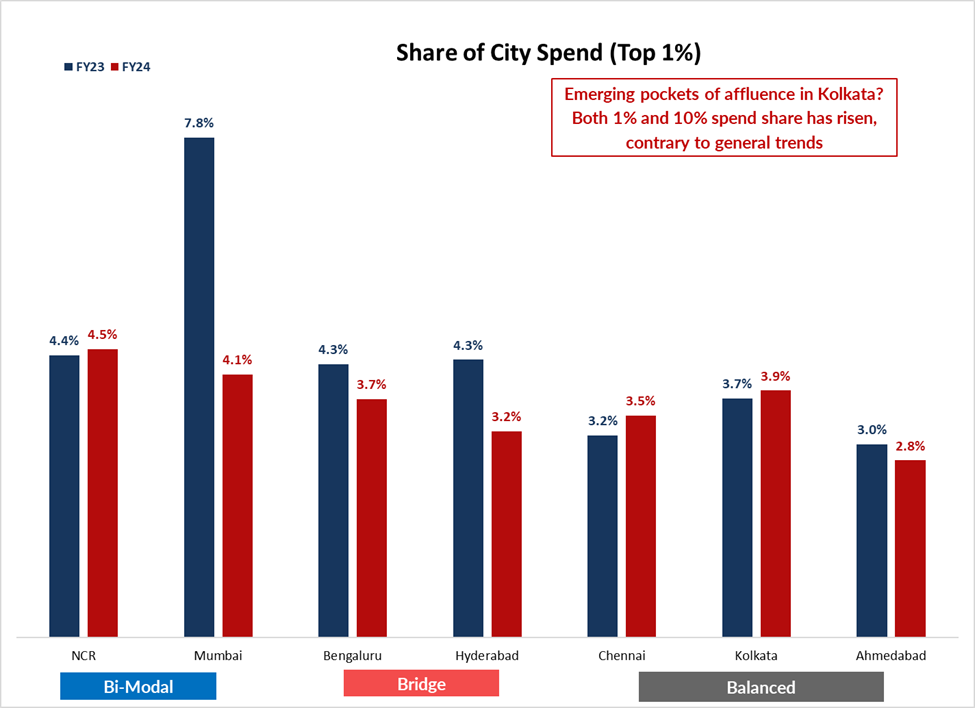
Chart E: Top 1% households have the highest share of spend in NCR and Mumbai
Source: MoSPI, HCES; 1: HCES Surveys only provide a directional indication on the spending on large durable goods, consumable services and food, without specifying the amount.

Chart F: Bengaluru and Kolkata have seen the spend share of Top 10% mildly rise
Source: MoSPI, HCES
The surveys don’t have a clear-cut reason as to why. We hazarded a guess by looking at the spending intent surveys – the reason seems to be a lower intent to spend on large durable goods in FY24. That pullback might be reflecting a switch in budgets from Durable Goods to services by Top spending households. Especially since a significant section of FY23 survey was conducted during a partial COVID lockdown, when the spending on services was muted.
In line with the dispersion trends, NCR and Mumbai have the largest share of spending by Top 1% and Top 10% HHs.
The other quirks we would like to highlight are Kolkata and Bengaluru.
Kolkata is the only city that has seen the share of spend rise for both Top 1% and Top 10% HHs. We wonder if that indicates emerging pockets of affluence in the city. Or simply that the city has attained a level of spending polarization, without a general increase in wallet size of even the Top 1% HHs, relative to other Tier-I Cities?
Bengaluru stands out for having seen the share of Top 10% increase, but that of the Top 1% decline. The question here is – whether the decline in Top 1%’s share is reflective of the tech-company layoffs through FY24, which might have tightened the belts for elite customers? Or if it indicates a gradual thickening of affluence to an increased spending from the remaining 9%?
There is a Growing Bharat Customer, Albeit With A Smaller Spending Capacity
Another interesting trend to look at is the spending share of Mass Market (HHs in the 25-75th percentile) and Emerging Premium (HHs in the 75th-90th percentile) in the total spend.
In general, the share of Mass Market HH has risen harmoniously across Tier-I Cities (except Kolkata) in FY24. However, the actual spending per HH remains at extremely low levels. As per our calculations, the daily budget per HH in this segment (ex-rent) would vary anywhere between INR400-900, including food. For context, that would be the just touchingly under the Average Order Value (AOV) for “value-centric” retail companies/platforms.
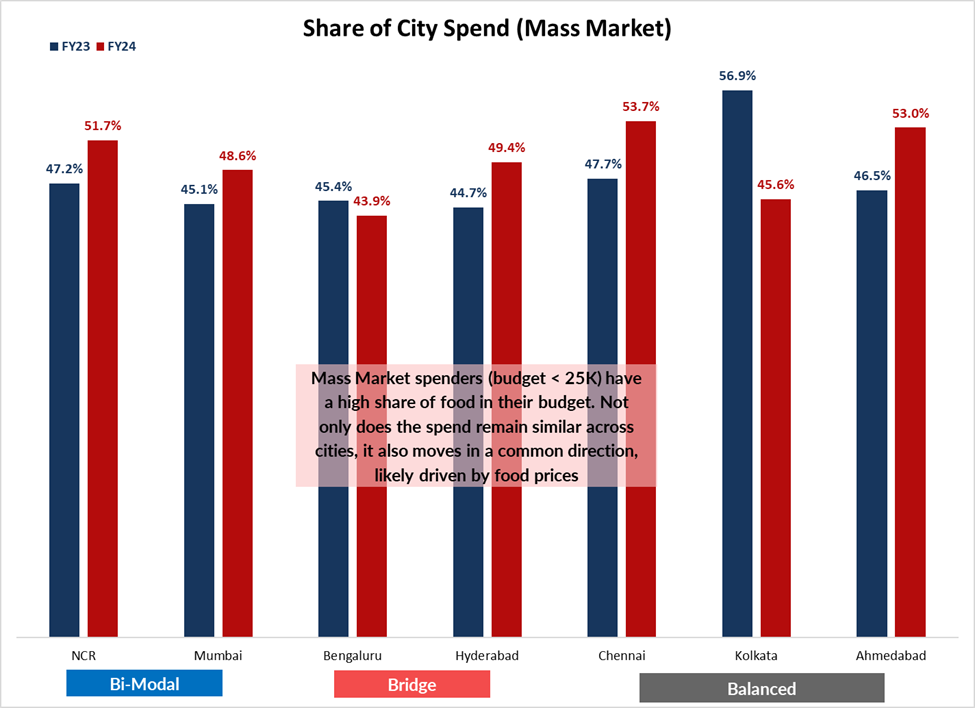
Chart G: Mass Market HHs likely gained the spend share lost by the Top 10% HHs
Sources: MoSPI, HCES; Mass Market HHs – Households between 25-75th percentile in each city

Chart H: High variance in spend share change-> Most regionally differentiated segment?
Sources: MoSPI, HCES; Emerging Premium HHs – Households between 75th-90th percentile in each city
On the other hand, Spending share of Emerging Premium HHs is the most varied across segments. These are the HHs with daily spending ranging between INR 800-1100. From FY23 to FY24, it has risen meaningfully in Kolkata and Ahmedabad; remained largely the same in Bengaluru, Hyderabad and Mumbai; and has fallen sharply in NCR and Chennai.
It isn’t incidental that spending share gain by Mass Market HH is nearly equal to the spending share loss by the Top 10% HHs. It seems that as HH spend moved away from large durable goods to food and services – it led to a bit of downward calibration along the consumer basket, with HHs with a higher spend on food making up a higher share of consumption.
Second, the challenge for companies building for “value-centric, price-sensitive” Bharat customers is that the consumption basket of HHs in the Mass Market segment is still dominated by food related expenditure. Which means that there is a high level of directionality and cyclicality in the spend share of this segment. Food being a relatively inelastic item, this share rises in the times of high food prices and falls otherwise. Thanks to infrastructural, welfare and GST related reforms, the food price difference by location has narrowed, which means that spend share variation also tends to happen in the same direction across cities.
Third, the variance in the trajectories of spending shares of Emerging Premium HHs in Tier-I Cities has a meaning. This is the first segment, in our view, to have meaningful spending power beyond food. Cost indices for services (education, transportation, medical services) and durable goods, tend to vary significantly across localities. For a spending segment at a lower tier than the Premium (Top 10% HHs) this could imply a slightly high elasticity to non-food prices. We suspect that could be the reason behind this being not just the most varied, but also the most highly differentiated HH tier, on a regional basis.
In FY24, Households with Lower Budgets Saw a Faster Growth in Spend
We wanted to test the hunches we had in the previous section – especially those around the increasing share of the Mass Market HHs.

Chart I: In FY24, HHs with Lower Budgets1 Saw a Faster Growth in Spend
Sources: MoSPI, RBI, HCES; 1:The x-axis in charts below shows the growth in spend between FY24 and FY23 for a particular decile of spend

Chart J: FY24: Higher Food Inflation-> Higher growth in spend of Low Spending HHs
Source: RBI
The result is the series of Charts shown below. For each city, a bar shows how much the HH budget did in that decile change between FY23 and FY24. Take Kolkata for example, in FY24, the 40th Decile HH had 40% greater spend than the HH in the 40th Decile in FY23.
In general, the green bars are to the left of the distribution for each city. That indicates for each city, it was the lower budget HHs that saw an increase in spending in FY24.
Once again, Kolkata and Bengaluru seemed to buck the trend. In these cities, HHs with higher wallet sizes saw their budgets expand.
One big reason for this increase in spending share by lower budget HHs could simply be the difference in food inflation between the survey period. Food inflation was 1.4pp higher during FY24 survey period than FY23. Interestingly, the overall CPI was 1pp lower. Do these inflation dynamics explain why the spend share of Top 10% HHs fell (more indexed to non-food inflation) whereas that of the Mass Market HHs rose (more indexed to food inflation)?
Now what does all this mean from a strategic perspective for businesses?
In the end, we would leave the readers with a few questions.
Bi-Modal markets tend to have an elite customer tier, which allows a greater room for product experimentation. Do these attributes mean that it is easier to conceive consumer internet companies (food delivery, online retail) in these markets than in Bridge markets? Like DNA that we inherit from our parents, will Bengaluru centric companies have different strengths, levers and margin trajectories than NCR-first companies?
Bi-modals are multi-tiered markets, Bridges are classic Upsell/Cross-sell plays and Balanced ones are built for scale over complexity. Given this spend distribution, which cities would you target as your initial market if you were to start your business today?
If you are a company building premium, high-margin experiences for your clients in a Bi-Modal market like Mumbai, when do you decide to go to a Bridge market like Hyderabad? How long are you willing to tolerate cash burn?
Is variance in spending structural to a particular city? Ahmedabad is in no way poor, but its spend is more equitably distributed, implying a low retail complexity. Even after accounting for growth, will cities like Ahmedabad and Chennai have a low variance in spend, even if spend per HH rises?
